Data - Add/Edit Data
Log into Predictor and select a Model.
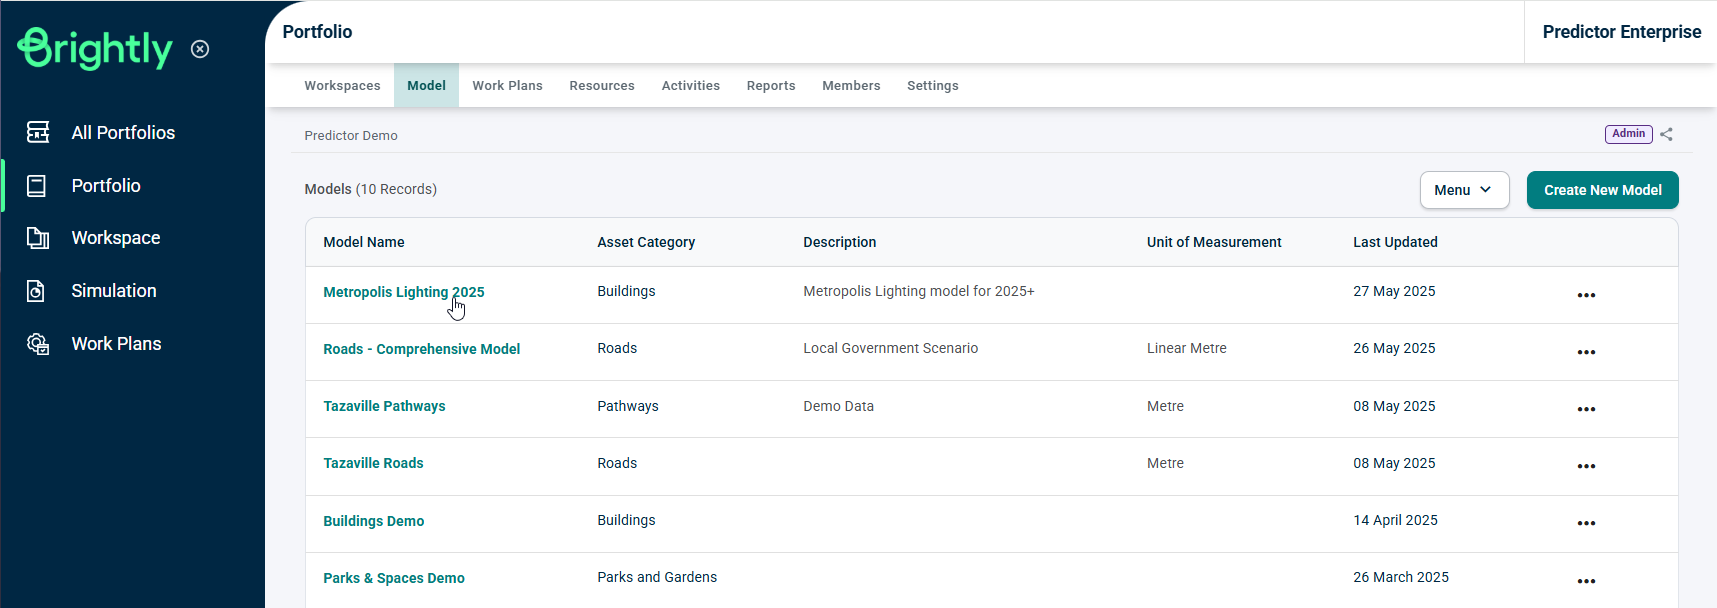
A sidebar will appear with the summary of the Model that has been selected. Scroll down and select 'Add' in the 'Data' section.
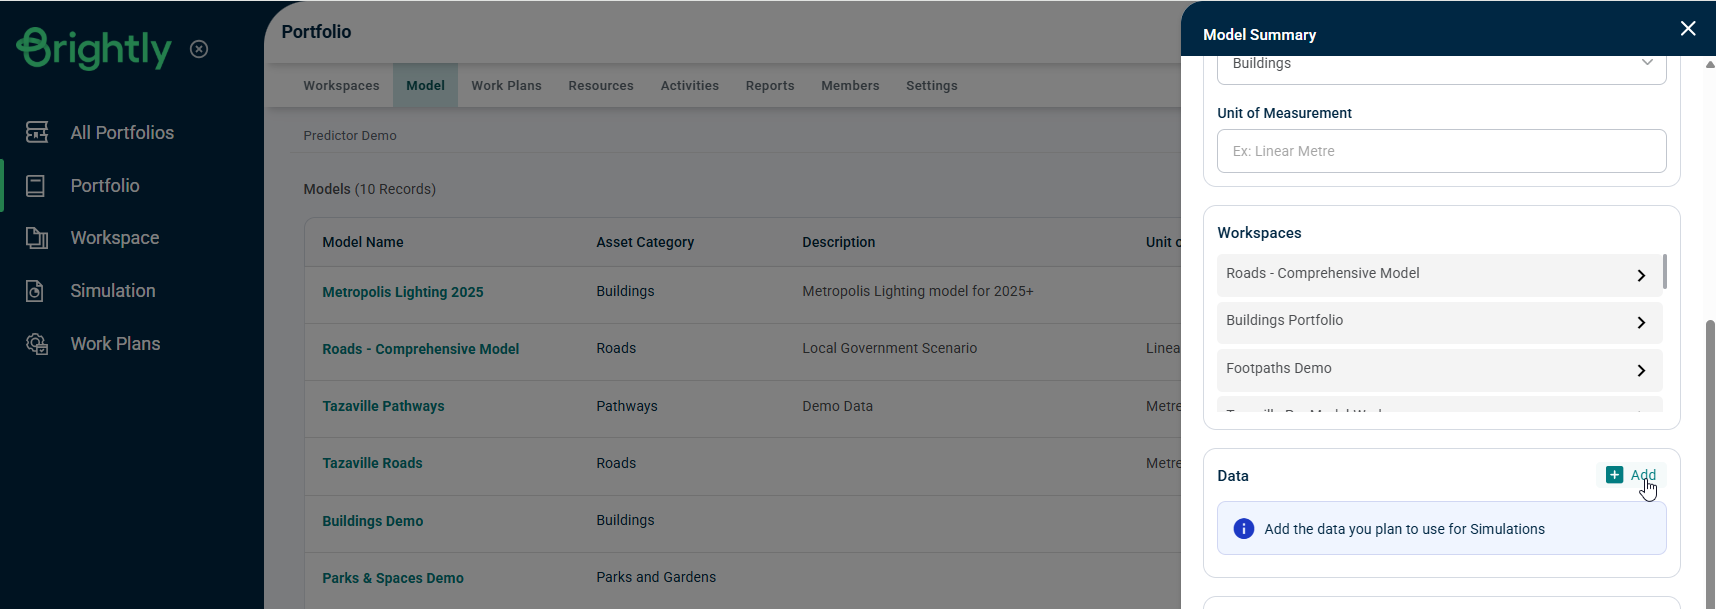
This will open the below pop-up:
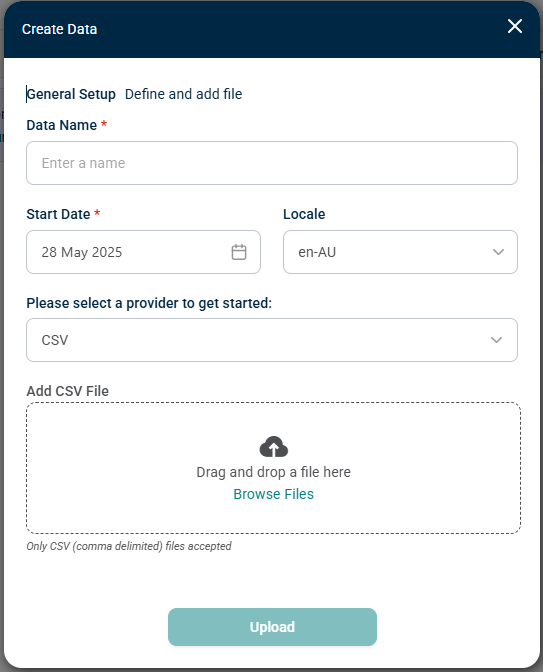
Name the data as it will appear in the Portfolio, select the import file and click Upload.
Note: The region setting (Locale) will determine which date format and decimal point mark is used and will default to the system settings. For performance reasons, the number of rows imported should be limited to 1,000,000 or fewer.
The data preview page will appear as shown below:
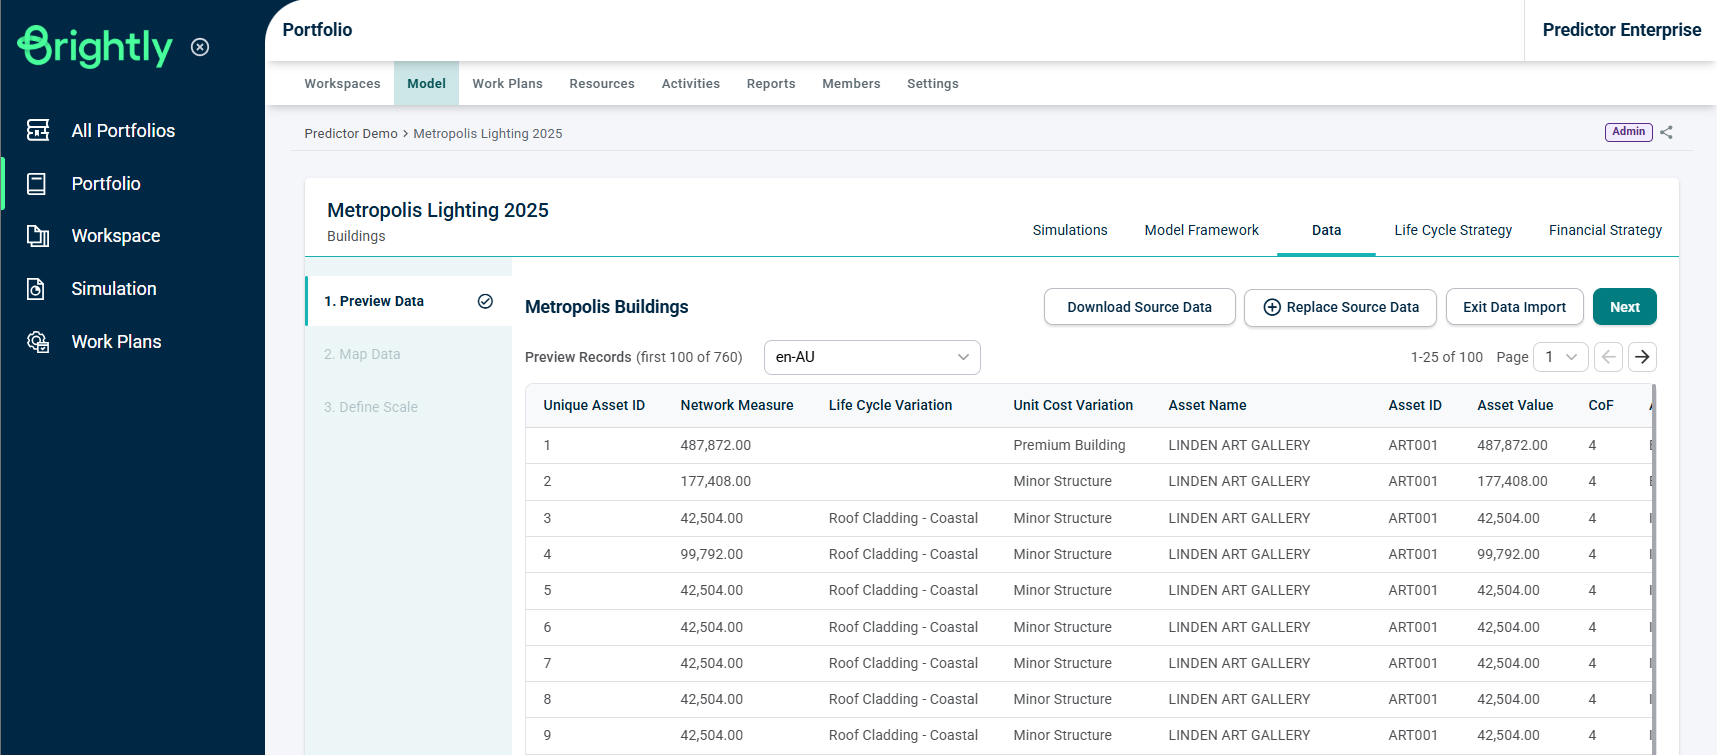
Check that the correct file is imported. If the correct file has not been imported, the 'Replace File' button can be used to re-select the file.
This step allows the user to confirm the validity of the file and the availability of all relevant data fields that may be required in modelling for the next steps. If the file looks OK, then click 'Next'.
In step 2, map the Input Data Fields to relevant fields in Predictor, by clicking on the drop-down menu of each field. All data column headers from the input file are visible, so the relevant data column for each field can be selected:
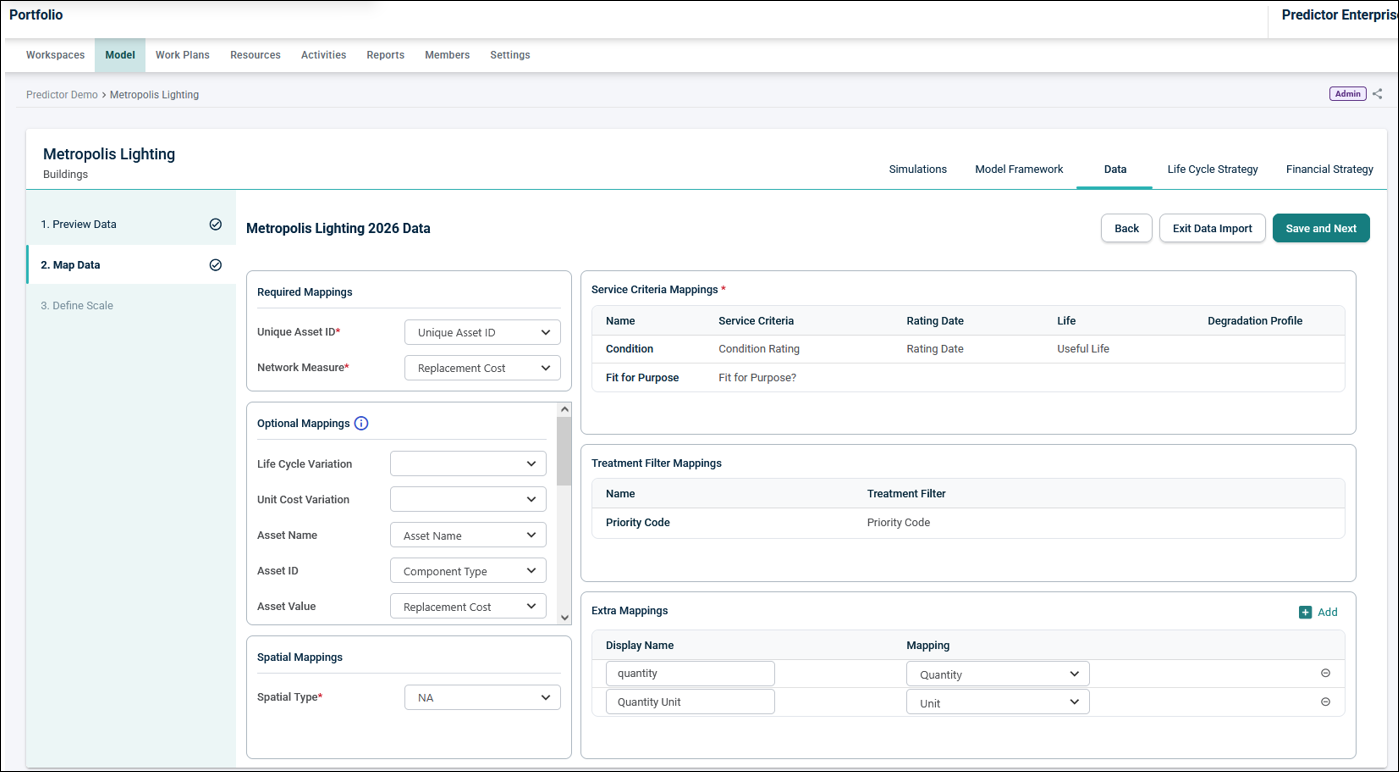
Note:After Data has been uploaded, there will be background processing performed by Predictor in order to populate the various mapping and scaling drop-downs. For large Data files, it is recommended to give Predictor some time to complete this processing before proceeding to the mapping and scaling. Predictor will give a warning notification if the mapping and scaling is started before this background processing is complete.
Required Mappings:
- Unique Asset ID: Each asset in the input data sheet must have a unique identifier.
- Network Measure: Network measure is used to indicate the absolute or relative size of the assets in a template. This can correspond to the physical size of the assets, such as the trafficable area for roads, length for pipes and floor area for buildings, or renewal cost, such as for buildings. The data file must contain numeric values for this mapping.
Optional Mappings:
-
Life Cycle Variation: If assets in imported data have different useful lives, Life Cycle Variation can be used to distinguish assets from predominant useful life.
-
Unit Cost Variation: The same treatment on different assets may incur different treatment costs. This can be due to location, criticality, or any specific nature of assets.
- Asset Name: It is recommended that Users provide an asset name for each of the assets, as this is helpful in identifying assets.
- Asset ID: If there is an asset ID, (e.g., a third party system ID), that is different to the unique asset ID, Users can map them to Asset ID.
- Asset Value: This is typically the unit replacement rate for the asset. The data file must contain numeric values for this mapping.
- Asset Class: One of a number of fields that can be filtered against when viewing Predictor Web App reports.
- Asset Sub Class: One of a number of fields that can be filtered against when viewing Predictor Web App reports.
- Asset Type: One of a number of fields that can be filtered against when viewing Predictor Web App reports.
- Asset Sub Type: One of a number of fields that can be filtered against when viewing Predictor Web App reports.
- Asset Criticality: One of a number of fields that can be filtered against when viewing Predictor Web App reports.
- Asset Hierarchy: One of a number of fields that can be filtered against whenviewing Predictor Web App reports.
- Location: One of a number of fields that can be filtered against when viewing Predictor Web App reports.
- Location Value: This field mapping is only available for Buildings and Facilities type categories, and is used for the FCI calculation in the Location Backlog report. If multiple Location Values are mapped to the same Location, the maximum value is used. The data file must contain numeric values for this mapping.
Service Criteria Mappings:
- Service Criteria: Map the Service Criteria to the relevant column in the import data. Note that there is a requirement that at least one Service Criteria must be mapped.
- Rating Date (Optional): Map the Rating Date for a Service Criteria to the column in the import data. If the field is left unmapped, or the imported cell for a specific asset is blank, then the Rating Date will default to the current date. The data file must contain date values for this mapping.
- Life (Optional): Map the Life for a Service Criteria to the column in the import data. If the field is left unmapped, or the imported cell for a specific asset is blank, then the value will default to the default life value configured in the Life Cycle tab of the Model. The data file must contain numeric values for this mapping, with a minimum value of 6.
- Degradation Profile (Optional): Map the Degradation Profile for a Service Criteria to the column in the import data. If the field is left unmapped, or the imported cell for a specific asset is blank, then the Degradation Profile used will default to the value configured in the Life Cycle tab of the Model.
Treatment Filter Mappings:
- Treatment Filter: For each Treatment Filter as defined in the Portfolio Model, a column is mapped from the import data.
Extra Mappings:
Custom mappings can be added here using the ‘Add’ button. A Display Name for each new Extra Mapping is specified, and then a column is mapped from the import data. These Extra Mappings can then be selected as attributes in the Work Planner Auto-packaging tool to guide the grouping of Treatments.
